Overview
In diagnostic radiology, routine tests are recommended to ensure that the image quality (IQ) level assessed at the equipment installation keeps substantially unchanged over time.
Current guidelines suggest that digital radiographic performance reproducibility can be evaluated by exposing daily/weekly/monthly phantoms containing several details regarding different aspects of image quality. The total number of details and their types vary between phantoms, but they often include series of low- and high-contrast details, different in size and shape, spatial resolution patterns, and step wedges for dynamic range and contrast resolution evaluation.
Digital images produced by modern equipments support the development of appropriate algorithms capable to automatically analyse phantom images and measure one or more objective image quality indices (IQI) from details available in the phantom. The evolution of IQIs over time can be used for monitoring long-term reproducibility of a radiological unit and detecting possible meaningful variations, which could be interpreted as “abnormal” over the normal statistical fluctuations of the imaging system. Traditionally, this is done by comparing the current value of each IQI with a reference level (baseline), by means of control charts, a graphical method introduced by Walter Shewhart to improve the quality of manufacturing processed by reducing their variability.
Using multiple control charts to describe changes in image quality over time is extremely useful to (1) assess the reproducibility of an imaging modality, and (2) distinguish “abnormal” changes from the normal, inherent process variations.
-
Training
After an appropriate training, AutoPIA learns the features of the equipment under control, the properties of the acquisition protocol in use and the average performance of the system.
-
Monitoring
During routine monitoring radiographers acquire and upload images, AutoPIA checks the images for coherence with exposure conditions defined at the training phase (the so-called baseline definition) by comparing the DICOM attributes; if anomalies are detected, AutoPIA notifies the radiographer who can correct them and send a new image.
-
Analysis
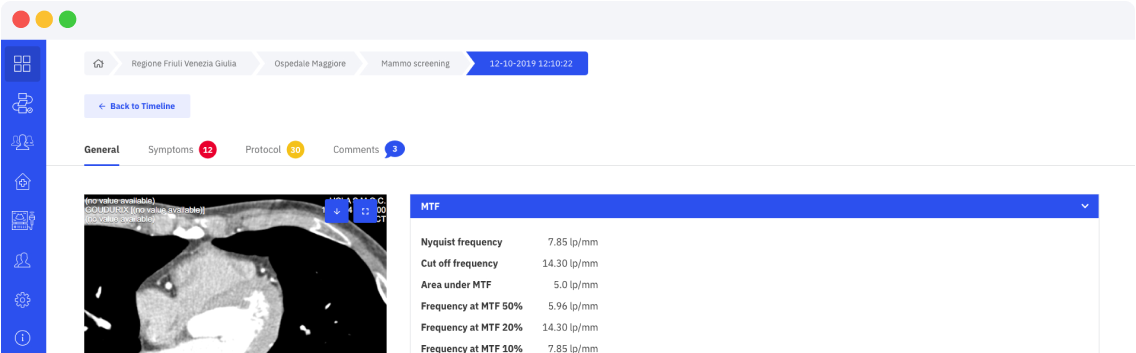
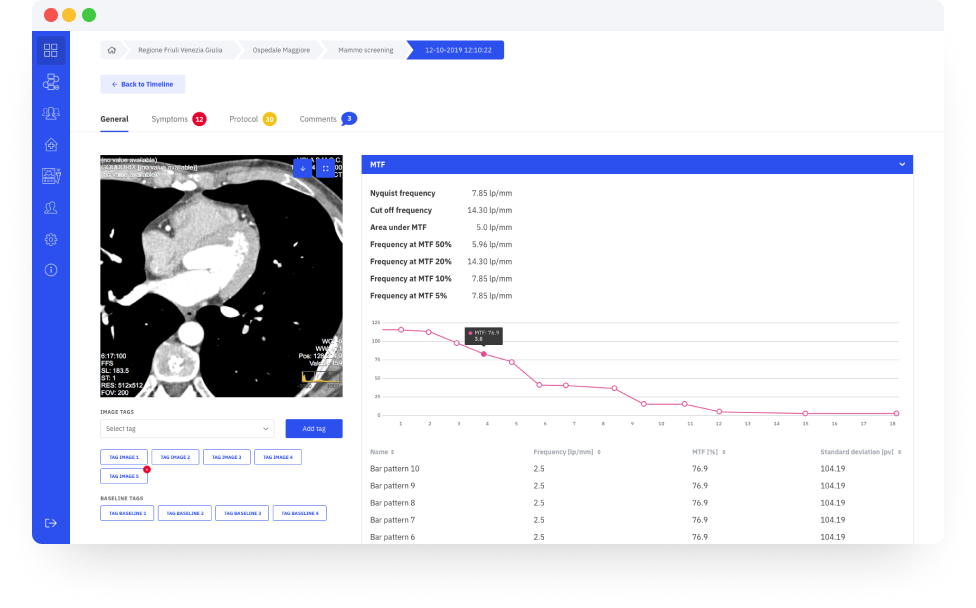
A coherent image is automatically analysed by AutoPIA (see AutoPIA Desktop specifications for more details), several IQI are calculated according to the type of phantom.
-
Control charts
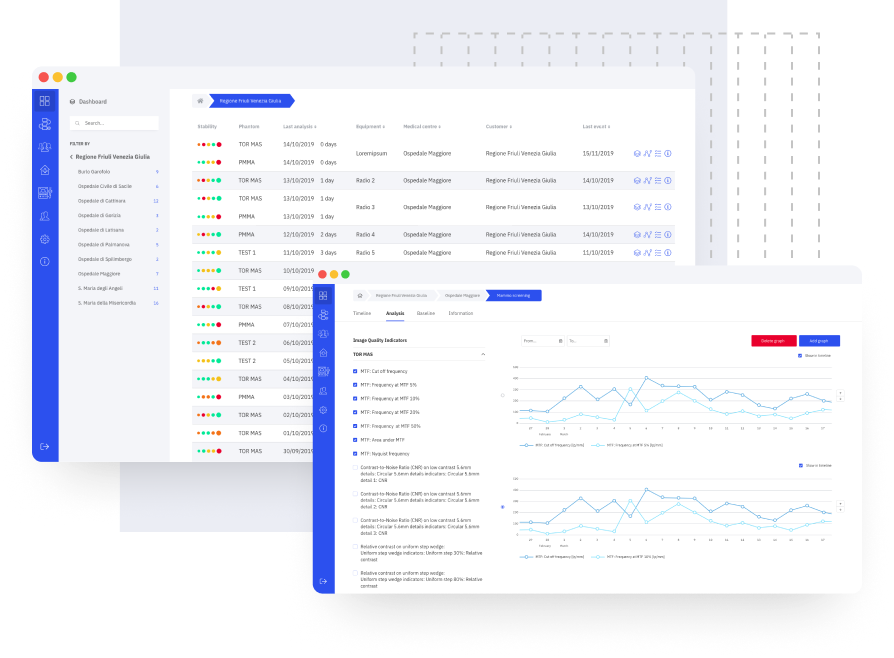
AutoPIA generates control charts and applies evaluation rules to determine the equipment performance.
-
Notification
In case of significant variations from baseline the expert in charge of the equipment is notified via e-mail.
-
Logs
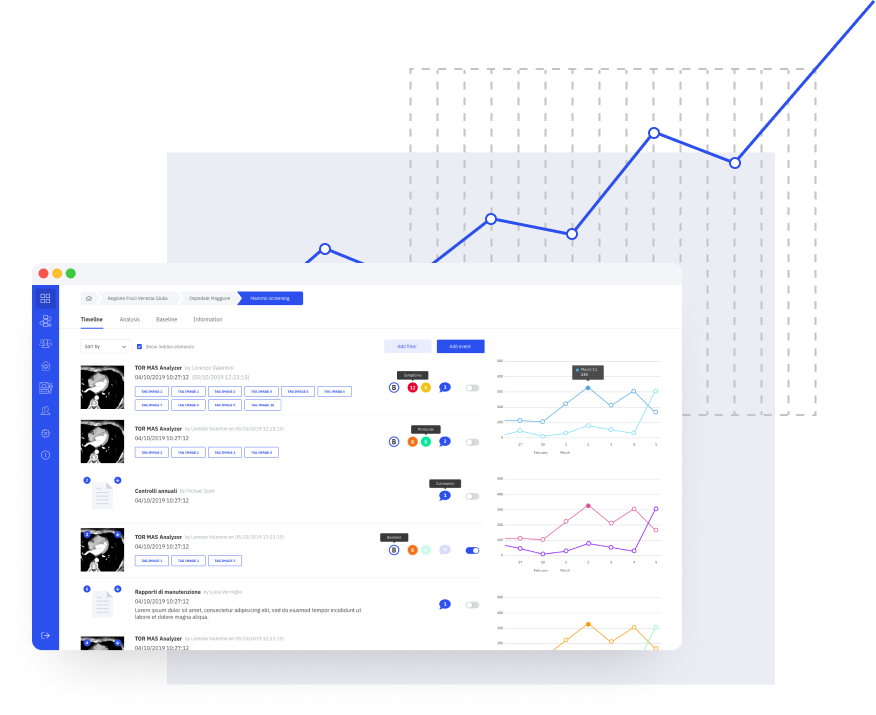
AutoPIA stores all uploaded images as well as the record of all detected conditions and all the image quality indices calculated during automatic image analysis; therefore, experts always have the possibility to retrieve this information, in particular when notified of anomalies. Information is presented in tabular form or in control charts with the control levels used by the applied rules; furthermore it is always possible to download images for custom in depth analysis
AutoPIA Cloud
with AutoPIA Cloud it is possible to monitor many equipments, located in different places, evaluating many aspects of image quality with a high sampling frequency